Dipoles
Creating dipole data
To get dipole moment information from LAMMPS, add something like this to your input file:
# create a group of atom types in the molecules you care about
group group_organic type < 5

# create a compute to assign a chunk ID for each molecule
compute molecule_chunks group_organic chunk/atom molecule

# create a compute for the center of mass location of each molecule
compute compute_com group_organic com/chunk molecule_chunks

# create a compute for the dipole of each methylammonium molecule
compute compute_dipole group_organic dipole/chunk molecule_chunks

fix fix_dipole   all    ave/time 30      1        30     c_compute_dipole[*] file dipoles_{temperature}K.out mode vector ave one title1 "Methylammonium Dipoles {temperature} K"
fix fix_com      all    ave/time 30      1        30     c_compute_com[*]    file molecule_location_{temperature}K.out mode vector ave one title1 "Methylammonium Center of Mass {temperature} K"
Reading dipole data
After the simulation, use get_dipole_data() to read the data from LAMMPS:
dipole_file = f'dipoles_{temperature}K.out'
location_file = f'molecule_location_{temperature}K.out'

dipole_data = np.empty(shape=(0,0))

dipole_data, data_rows = get_dipole_data(dipole_data, dipole_file, location_file, temperature)
If you allocate the array dipole_data before calling get_dipole_data() it may run
faster, for example:
import numpy as np
data_rows = int(np.ceil(simulation_timesteps / simulation_sampling_interval)) * num_molecules
dipole_data = np.empty((data_rows, 12))
Visualizing dipole data
lammps_helper provides a few functions to help visualize dipole orientations:
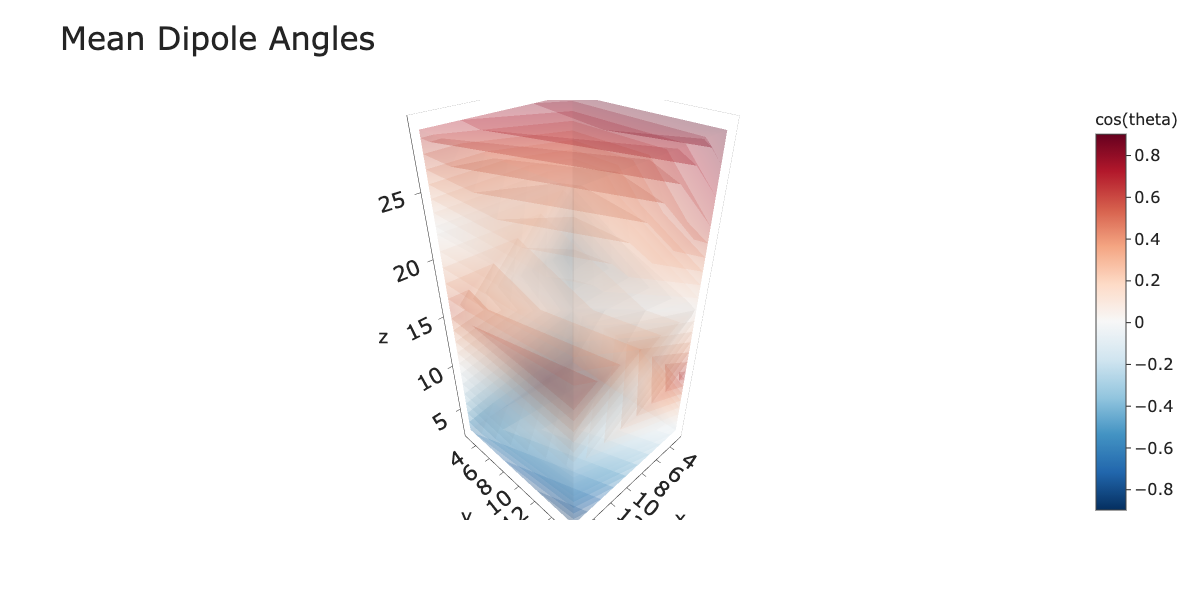
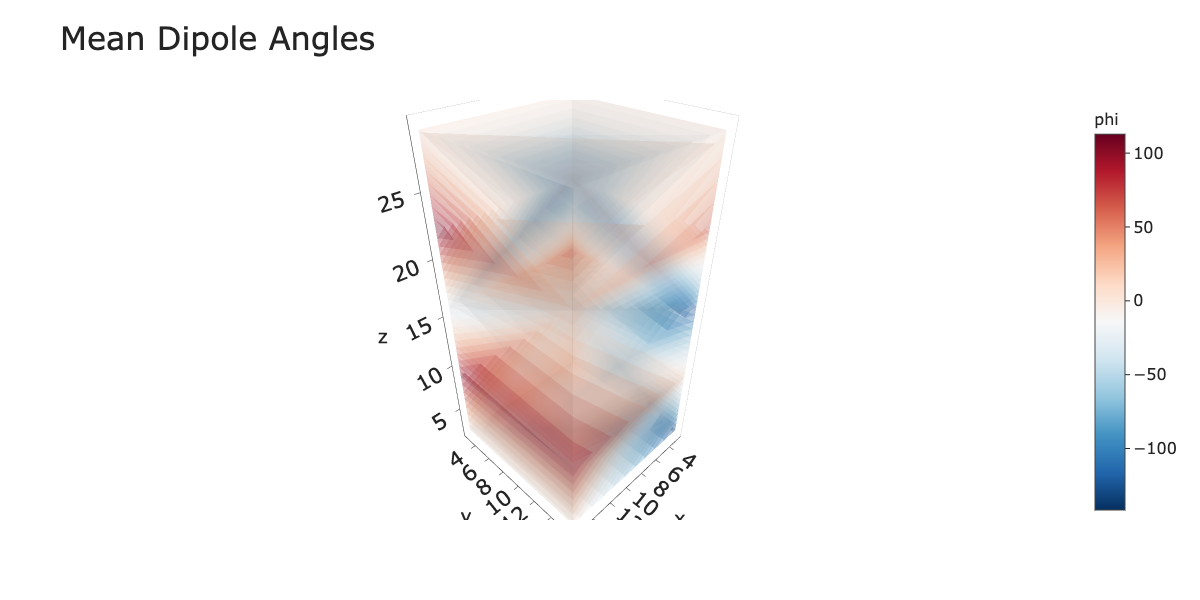
make_dipole_contour_plot()plot_mean_dipole_orientation()plot_mean_dipole_angles()
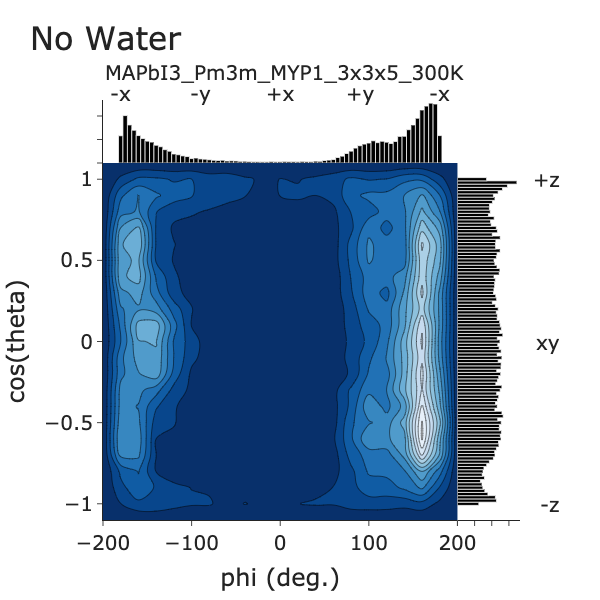
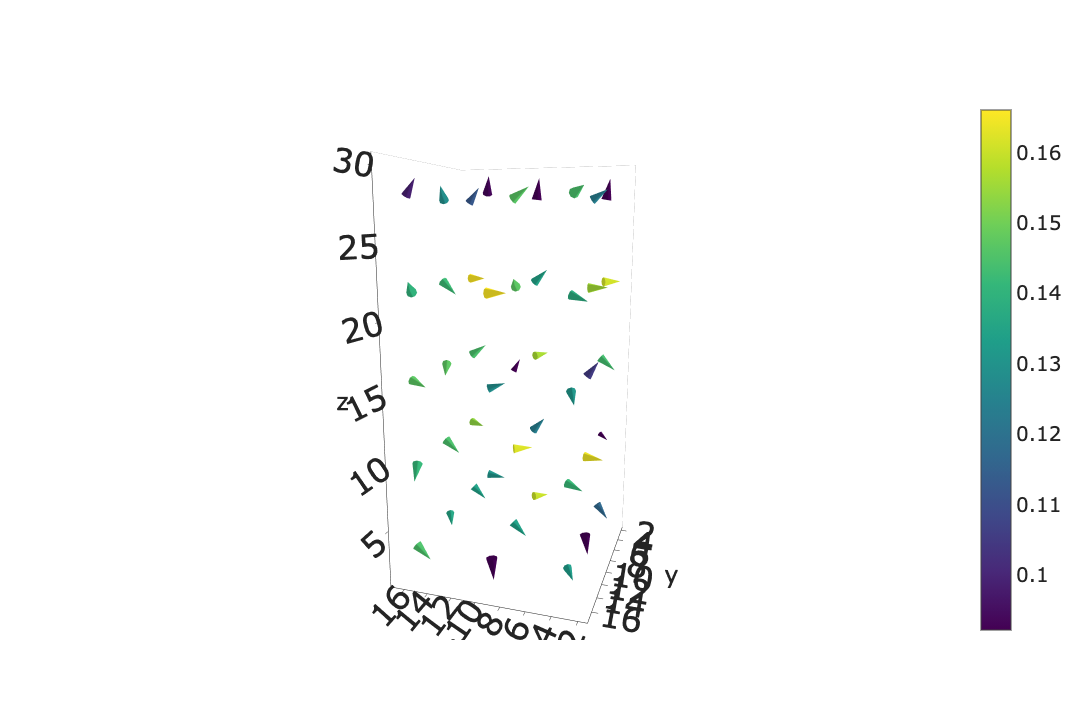
The first gives a 2D histogram, the second gives a 3D vector plot of the average molecule orientations, the third gives a volume plot of average dipole angles cos(theta) and phi.
To view a histogram of dipole orientations over the course of the simulation:
fig = lh.make_dipole_contour_plot(dipole_data, title = 'No Water', subtitle = output_base_name)
fig.show()
To view a 3D plot of the average orientation of each molecule:
fig = plot_mean_dipole_orientation(dipole_data)
fig.show()
To view a 3D plot of the dipole angles:
fig_cos, fig_phi = lh.plot_mean_dipole_angles(dipole_data)
fig_cos.show()
fig_phi.show()